Amazon PPC Automation: Bid vs Acos analysis
As a part of ongoing initiative at AiHello to make PPC Ads optimization more efficient, we are working to upgrade all our algorithms from our current ARIMA model to a CNN or a LSTM model.
We will be running a series of tests and comparing the results between simple regression, machine learning by CNN, machine learning by LSTM and finally using Deep Learning by other Neural Networks.
Our initial observation and hypothesis is that bids are affected by seasonal variations. We will be running a non-time series machine learning via CNN and a time-series based LSTM network and comparing their differences.
The below post outlines the initial data, observation and analysis of data.
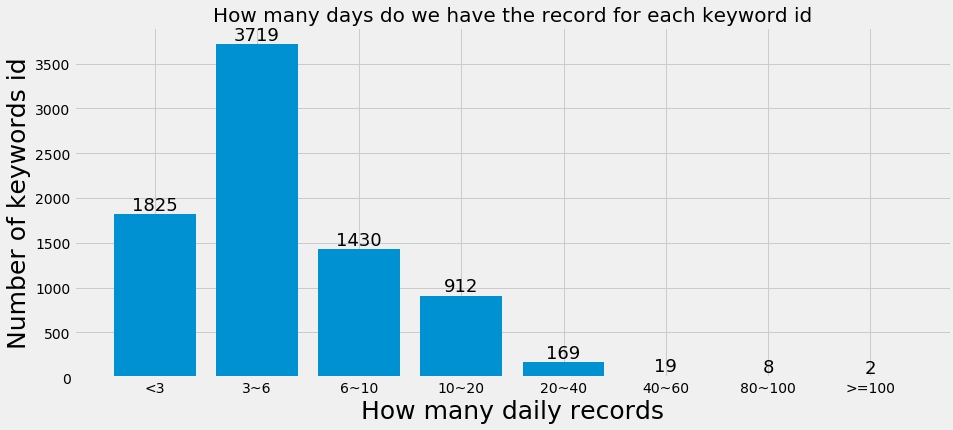
1.1) There are around 40k distinct keyword IDs in the dataset, with an average of 7 days records for each keyword ID. Most keywords have a one-week record rather than a long-term record.
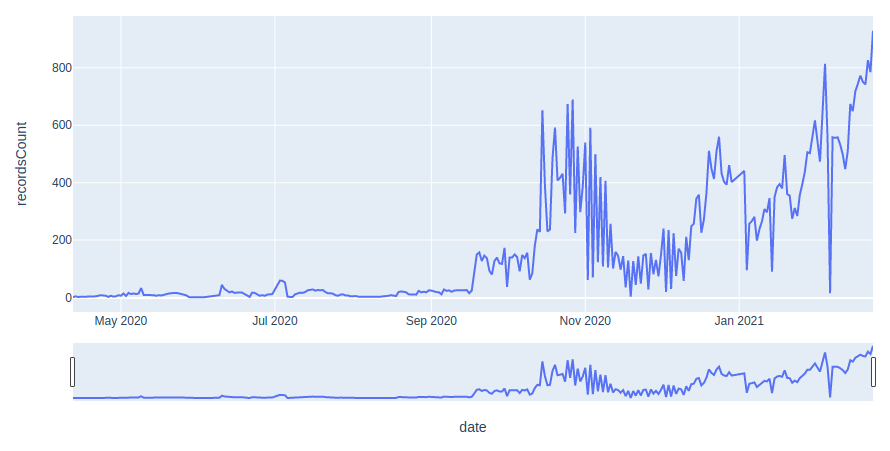
1.2) Removing the Sales = 0 Records:
Over 83% of the data having Sales = 0, which indicates that most keywords ID fail, resulting in zero sales.
We drop the Sales = 0 rows, and there are around 8k keyword IDs left, However, the continuity of records decreases, compared with the original dataset. This indicates that even though lots of keyword ID fails the client still would like to try the ad bidding strategy for a longer time.
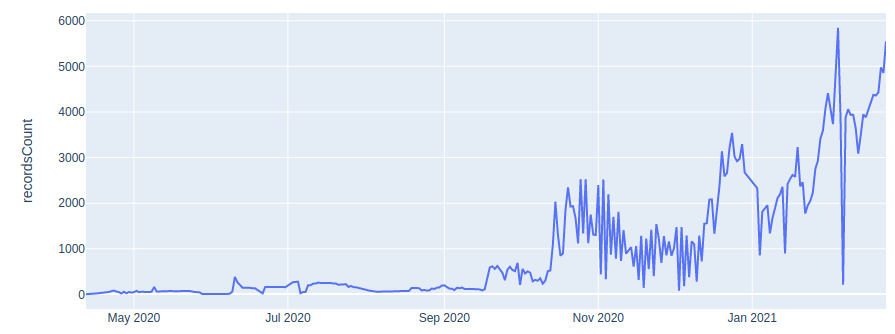
2. Correlation Analysis
1) Linear Correlation Check by Pearson Correlation
The Pearson Correlation Matrix indicates that there is a positive linear relationship between the Sales and the Bid Price, and a positive linear correlation between the Sales and Cost. However, the ACOS does not have an obvious linear correlation with Bid Price, Cost, or Sales. The reason might be ACOS is impacted by multiple factors, or it might because the correlation is non-linear.
[caption id="attachment_3697" align="aligncenter" width="408"]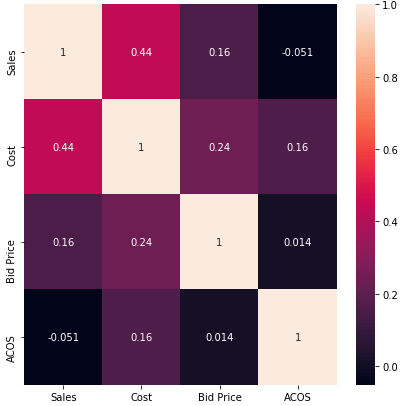 Original Data[/caption]
[caption id="attachment_3706" align="aligncenter" width="449"]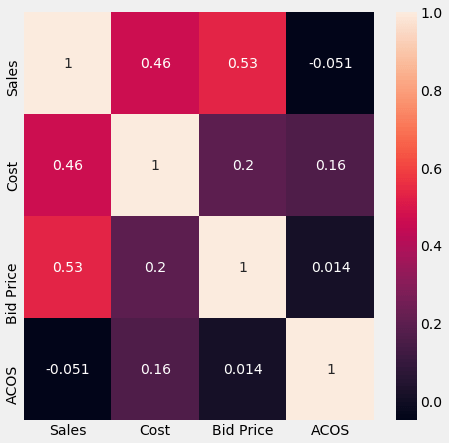 Without Sales = 0[/caption]
2.2) Data Plotting Visualization
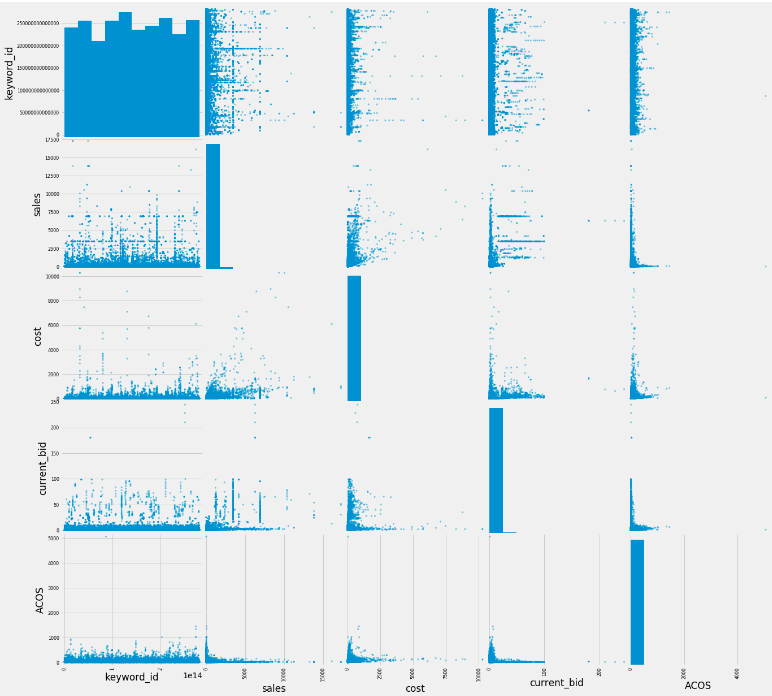
To better understand the relationship between Cost, Sales, and ACOS, we plot the data distribution. We have the following findings: most data are not in a 1-v-1 relationship, for example, one ACOS can be mapped to multiple sales, bid prices, and costs. This finding proves the ACOS is impacted by multiple factors, instead of one. The second finding is the relationship between the data is non-linear, which means the basic linear regression is unable to handle the regression problem between ACOS and Bid Price. Another finding is the profit pattern, indicated on the right-lower figure. The figure plots Cost versus Sales and the size and color of the scatter points indicates the ACOS values, the smaller and darker scatter point means the ACOS is lower, in other words, it is more profitable. It can be found there are two obvious groups of ACOS: blue group and red group. The red group contains the keyword IDs that spend less cost but gain more sales than the blue group.


3. Trending Analysis
1) All Data
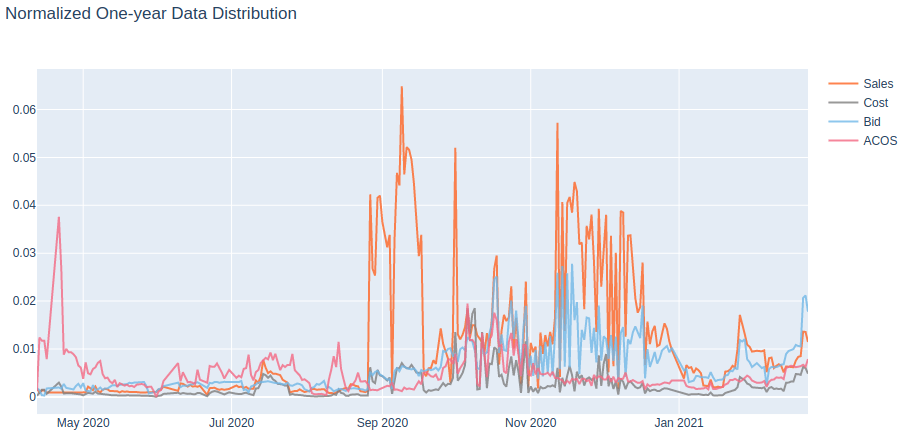
The data covers from April 2020 to February 2021, and are Min-Max normalized. The Sales changes significantly, especially after Sept 2020. Bid Price increases since Oct 2020. Please note there can be some bias caused by the currency rate due to many Japanese clients. It shows the ACOS does not vary very much, compared with Sales. Since ACOS = Cost/ Sales, it eliminates the impact of the currency rate naturally, it is only biased by the regional market condition. From ACOS, we find there is a peak region between Oct to Nov 2020, indicating the ad campaign works well at that time period, with less cost but more sales. The reason behind that might because of clients, or because of the market.
3.2) ACOS with Different Keyword Match Type
It turns out that the keyword with different match types could result in slightly different ACOS, especially from the data before Sept 2020. After Sept 2020, the difference tends to be decreased. After Nov 2020, ACOSs are almost in the same distribution. Combining with the figure from slide page 5, which says there are much more data from after Oct 2020, we could say once we have large enough data, we can see that the ACOSs of different keyword match types are almost the same.

3.3) ACOS and Bid Price with Different Keyword Match Type
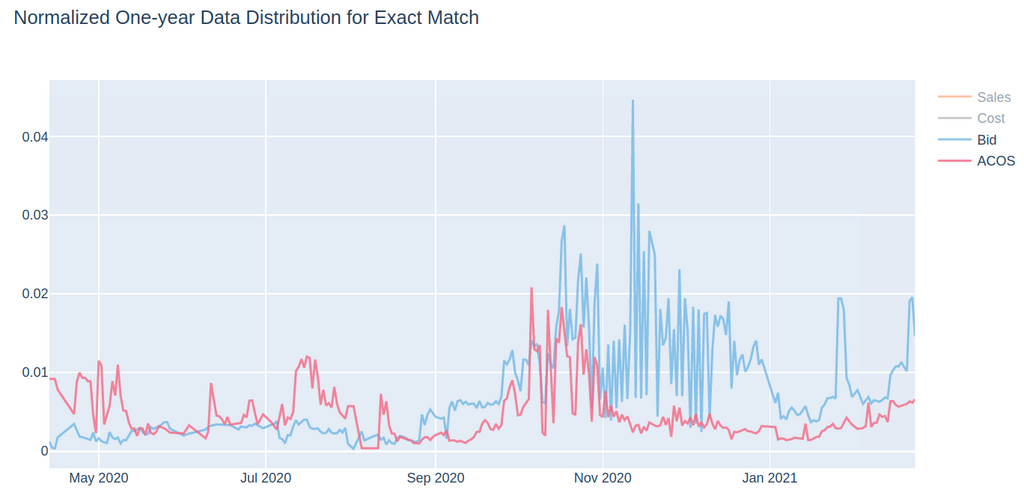
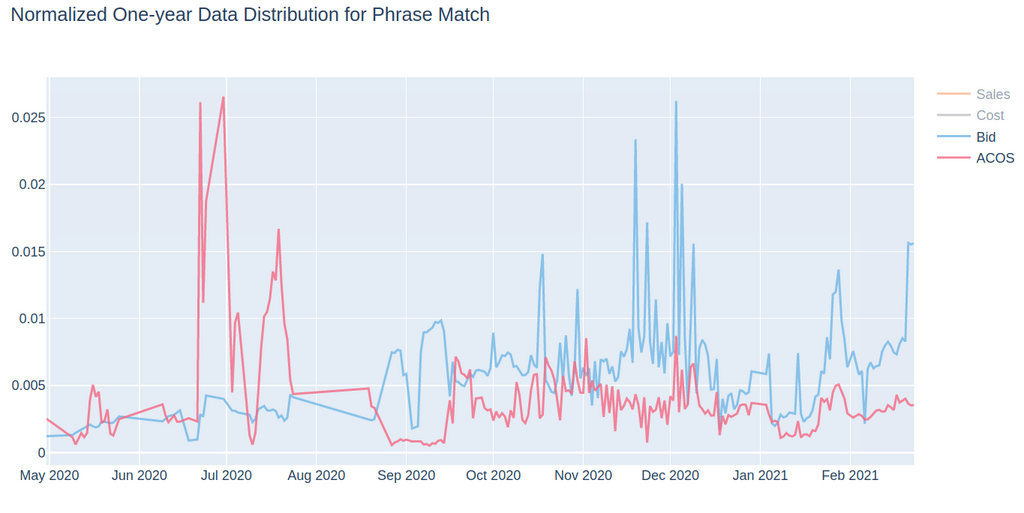
Even though the ACOS of different keyword match types might be identical, the bid prices for different match types are not the same. The exact match type and broad match type have very similar bidding price distribution, but the phrase type is different. (Note the y-axis values and the trend.) This might indicate the relationship between the bidding price and ACOS may be different for different keyword match types.

4. Bias Analysis
The exploration results may be biased by the currency rate and the regional market condition.
We will be running a series of tests and comparing the results between simple regression, machine learning by CNN, machine learning by LSTM and finally using Deep Learning by other Neural Networks.
Our initial observation and hypothesis is that bids are affected by seasonal variations. We will be running a non-time series machine learning via CNN and a time-series based LSTM network and comparing their differences.
The below post outlines the initial data, observation and analysis of data.
- Data Scale/size
1.1) There are around 40k distinct keyword IDs in the dataset, with an average of 7 days records for each keyword ID. Most keywords have a one-week record rather than a long-term record.

1.2) Removing the Sales = 0 Records:
Over 83% of the data having Sales = 0, which indicates that most keywords ID fail, resulting in zero sales.
We drop the Sales = 0 rows, and there are around 8k keyword IDs left, However, the continuity of records decreases, compared with the original dataset. This indicates that even though lots of keyword ID fails the client still would like to try the ad bidding strategy for a longer time.


2. Correlation Analysis
1) Linear Correlation Check by Pearson Correlation
The Pearson Correlation Matrix indicates that there is a positive linear relationship between the Sales and the Bid Price, and a positive linear correlation between the Sales and Cost. However, the ACOS does not have an obvious linear correlation with Bid Price, Cost, or Sales. The reason might be ACOS is impacted by multiple factors, or it might because the correlation is non-linear.
[caption id="attachment_3697" align="aligncenter" width="408"]
 Original Data[/caption]
[caption id="attachment_3706" align="aligncenter" width="449"]
 Without Sales = 0[/caption]
2.2) Data Plotting Visualization
To better understand the relationship between Cost, Sales, and ACOS, we plot the data distribution. We have the following findings: most data are not in a 1-v-1 relationship, for example, one ACOS can be mapped to multiple sales, bid prices, and costs. This finding proves the ACOS is impacted by multiple factors, instead of one. The second finding is the relationship between the data is non-linear, which means the basic linear regression is unable to handle the regression problem between ACOS and Bid Price. Another finding is the profit pattern, indicated on the right-lower figure. The figure plots Cost versus Sales and the size and color of the scatter points indicates the ACOS values, the smaller and darker scatter point means the ACOS is lower, in other words, it is more profitable. It can be found there are two obvious groups of ACOS: blue group and red group. The red group contains the keyword IDs that spend less cost but gain more sales than the blue group.


3. Trending Analysis
1) All Data
The data covers from April 2020 to February 2021, and are Min-Max normalized. The Sales changes significantly, especially after Sept 2020. Bid Price increases since Oct 2020. Please note there can be some bias caused by the currency rate due to many Japanese clients. It shows the ACOS does not vary very much, compared with Sales. Since ACOS = Cost/ Sales, it eliminates the impact of the currency rate naturally, it is only biased by the regional market condition. From ACOS, we find there is a peak region between Oct to Nov 2020, indicating the ad campaign works well at that time period, with less cost but more sales. The reason behind that might because of clients, or because of the market.

3.2) ACOS with Different Keyword Match Type
It turns out that the keyword with different match types could result in slightly different ACOS, especially from the data before Sept 2020. After Sept 2020, the difference tends to be decreased. After Nov 2020, ACOSs are almost in the same distribution. Combining with the figure from slide page 5, which says there are much more data from after Oct 2020, we could say once we have large enough data, we can see that the ACOSs of different keyword match types are almost the same.

3.3) ACOS and Bid Price with Different Keyword Match Type
Even though the ACOS of different keyword match types might be identical, the bid prices for different match types are not the same. The exact match type and broad match type have very similar bidding price distribution, but the phrase type is different. (Note the y-axis values and the trend.) This might indicate the relationship between the bidding price and ACOS may be different for different keyword match types.


4. Bias Analysis
The exploration results may be biased by the currency rate and the regional market condition.
